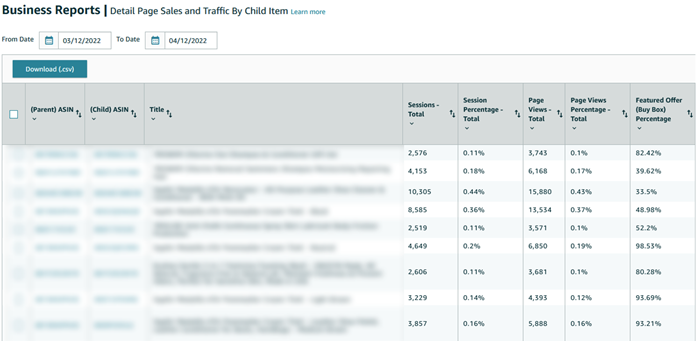
Amazon recently announced changes to its to Business Reports, which give insight into your traffic, buy box, and sales information per ASIN. These reports live in the Reports menu of your Seller Central account.

Addition of Mobile App Traffic Data in Business Reports
Amazon has now introduced mobile app traffic data into the business reports. Previously, Amazon only included desktop browser and mobile web browser data in their business reports. With this update, however, it will also include mobile app data which had not previously been reported.

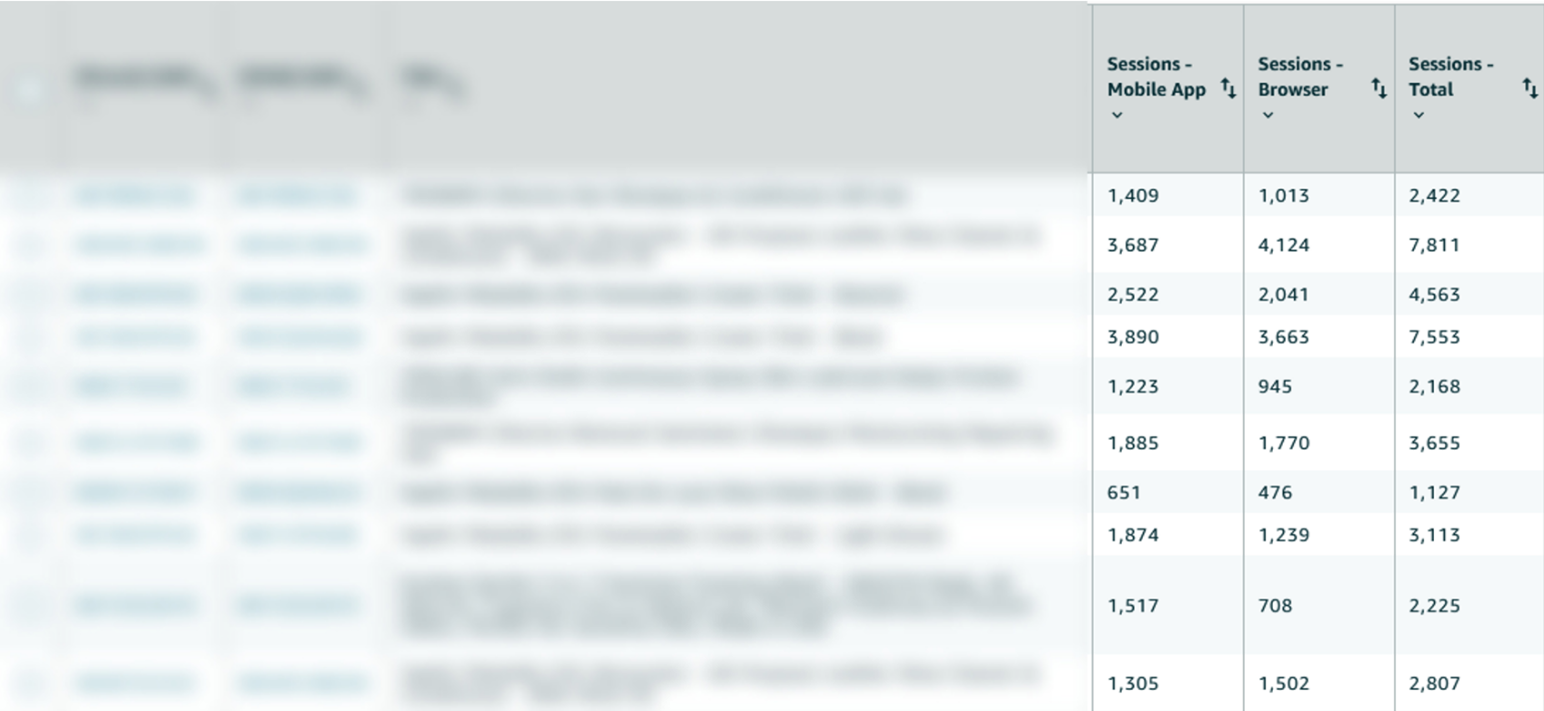
There are now three traffic types in Business Reports:
- “Browser”, which was the previous default and combines desktop, tablet, and mobile web browser traffic.
- "Mobile App”, which is the new type of traffic Amazon just added.
- "Total”, which combines browser and mobile app traffic.
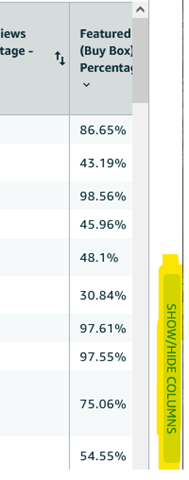
Accessing the new columns isn’t intuitive at first glance. To access these new data columns, click on the “Show/Hide Columns” icon to the right of your business report. Then, check the boxes to add the extra columns and then hit “Save”.

The result will look something like this:

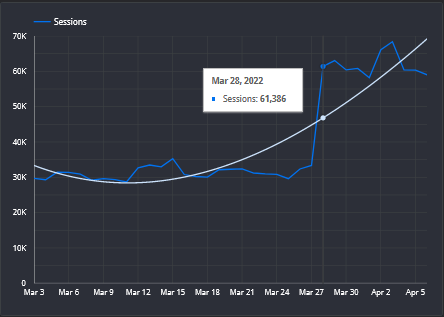
If you have been downloading daily or weekly business reports and saving them in a database or Google Doc for reporting, a graph of sessions or page views may look similar to the graph below, where the traffic appears to have doubled. This is because Amazon replaced the old “Sessions” and “Page Views” columns (which were only reporting on browser traffic) with “Sessions - Total” and “Page Views – Total", which now combines browser and mobile app traffic.

Moving forward, you will need to readjust your columns in order to maintain continuity of your traffic data.
Session Versus Page View
A session is the number of unique visitors, while a page view is the total number of product detail page views from those unique visitors.
For example, let’s say your product page showed 500 sessions yesterday, and 1,000 page views. You could safely assume that each session averaged about 2 visits to the product page.
The Impact on Sellers
It appears that Amazon has updated historical business reports of approximately the last 12 months of the mobile app data, so if you go back and pull previous reports, they will now reflect the new addition of the mobile app data as compared to when they were originally pulled.
Proceed with caution when reviewing year-over-year (YoY) traffic and conversion rate comparisons because it doesn’t appear that data from 2020 includes the mobile app data.
This update will not affect your buy box percentage numbers, but it will affect what you thought your conversion rates were. Amazon had previously shown you all revenue and units sold across web and app, but only reported on sessions and page views from desktop and mobile browser, leaving out app traffic. With the introduction of app traffic, your conversion rates will likely look like they got cut in half. This also means that you’ve actually been getting about double the traffic to your listings than you previously thought.
Initial figures in our account show that mobile app traffic is roughly 50% of total traffic across all products, but some products with decent traffic are as high as 77% mobile app traffic and as low as 11%. Regardless of the weighting of mobile app traffic, you need to ensure that your product listing looks great on mobile in order to either capitalize on the high percentage of mobile app traffic or increase the sell-through rate of your listings with a low percentage of mobile app traffic in order to give it a boost in the rankings.
If you are looking for assistance with your Amazon account, or would like to discuss this topic in more detail, contact our team of experts to learn how Blue Wheel can help you achieve your marketplace goals.


.jpg)


.jpg)

.png)
.png)